INTRODUCTION
Options Czar is a program that was developed to help the user design strategies for Equity (Stock) Options or other underlying assets that are traded in the Chicago Board Options Exchange (CBOE). The ultimate purpose of these strategies is to
- improve the risk/return performance of the user's current stock portfolio, or
- seek profits in a pure-options investment.
Options Czar reads End-Of-Day and 20-minute delayed CBOE market data so the user can work with the available Options that are offered and demanded in the market at that time. The EOD data is available through subscription and contains ALL the assets and options that were available in the market in the said day. Each afternoon, the user will be able to download the data automatically and be able to design strategies with any asset that was traded in the market. The 20-minute delayed data is available free of charge but requires the data be downloaded from the CBOE web site through a web browser, saved into the hard disk and then loaded from the Options Czar application.
Each file contains the prices, volumes and other information for all the options in the chain. With the text data, the user can perform manual Buy and Sell operations and see how they perform through different stock price behaviors. Additionally, Options Czar provides advanced tools as the Market Trend, where the user can read the market's expectation on the stock price (based on premiums over calls or puts pricing), or the Strategy Maker, which uses the user's expectations on a specific stock price and the available investment cash to calculate the best Options strategies.
Hence, the main purpose of Options Czar is to make Options trading more accessible for the average stock trader. Even if the trader does not use options frequently, this application will help him/her handle stock while opening the door to the world of options. Broker support is always advisable when initially using a tool as Options Czar.
What does Options Czar do?
As mentioned before, the CBOE is the market that provides the data for Options Czar. This data is handled within Options Czar in two basic forms, end-of-day (paid) and 20-minute delayed data (free). The EOD data contains the data for each asset (stocks or indexes) that is traded in the USA stock markets and the options chains. The options chain (or montage) is the number of options that are in the market for a given asset. For example, on a given day, MSFT (Microsoft, Inc.) trades 235 call and 235 put options (not including LEAPSTM). These options go by ticker names like ZQN DP-E, ZQN DP-A, etc. The 20-minute delayed data just includes one chain.
The Options Czar user can analyze the historical data (available within the program) or news (available in sites such as Yahoo!) pertaining a given asset to guess its future behavior. This behavior may be for the next days, weeks or even months. Options Czar will help him/her profit (and/or limit losses) by selecting the tools that take most advantage of the given predictions, be it bullish (you think the price will increase), bearish (think it will drop) or neutral (think it will more or less stay the same). Options Czar does this by listing the available options with their market data (price, volume, etc.) and graphing the outcome of operations with these options to view the pros and cons of each position in a clearer fashion. The advantage of options is that they allow the investor to profit from a wide variety of stock price behaviors, such as:
- Increase in stock price.
- Decrease in stock price.
- High stock price volatility (price can move to whichever end).
- Low stock price volatility (price stays about the same).
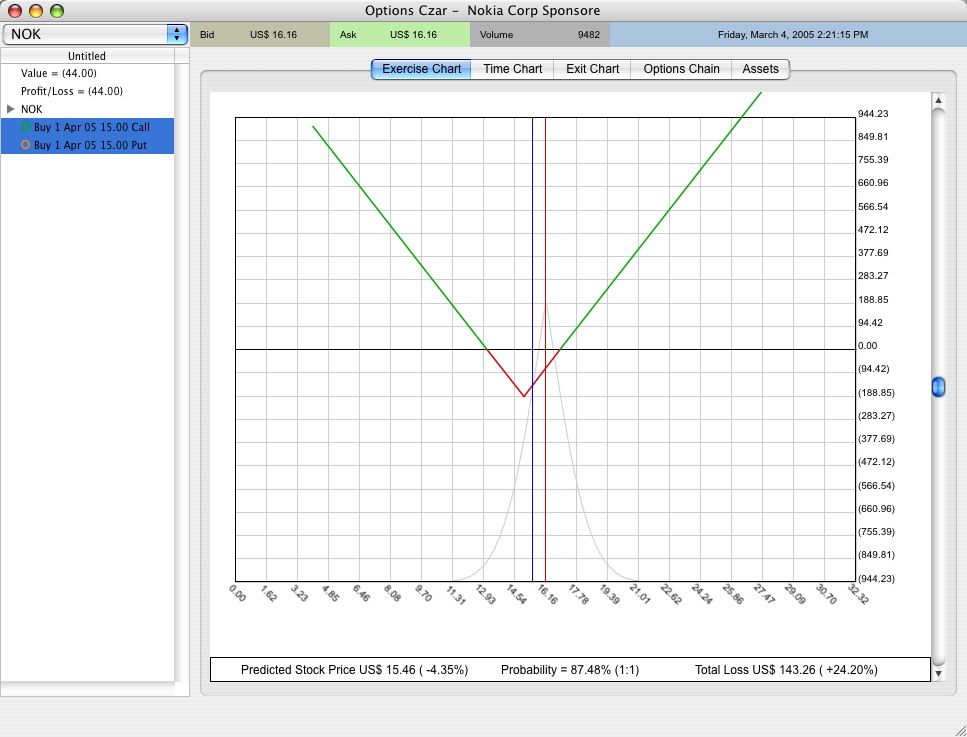
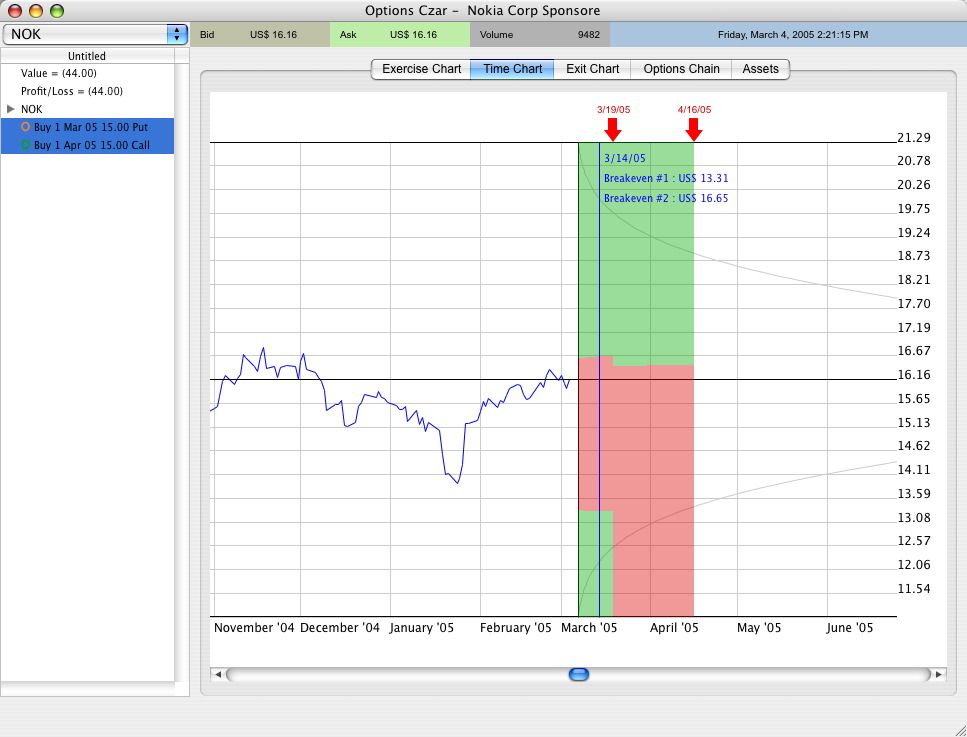
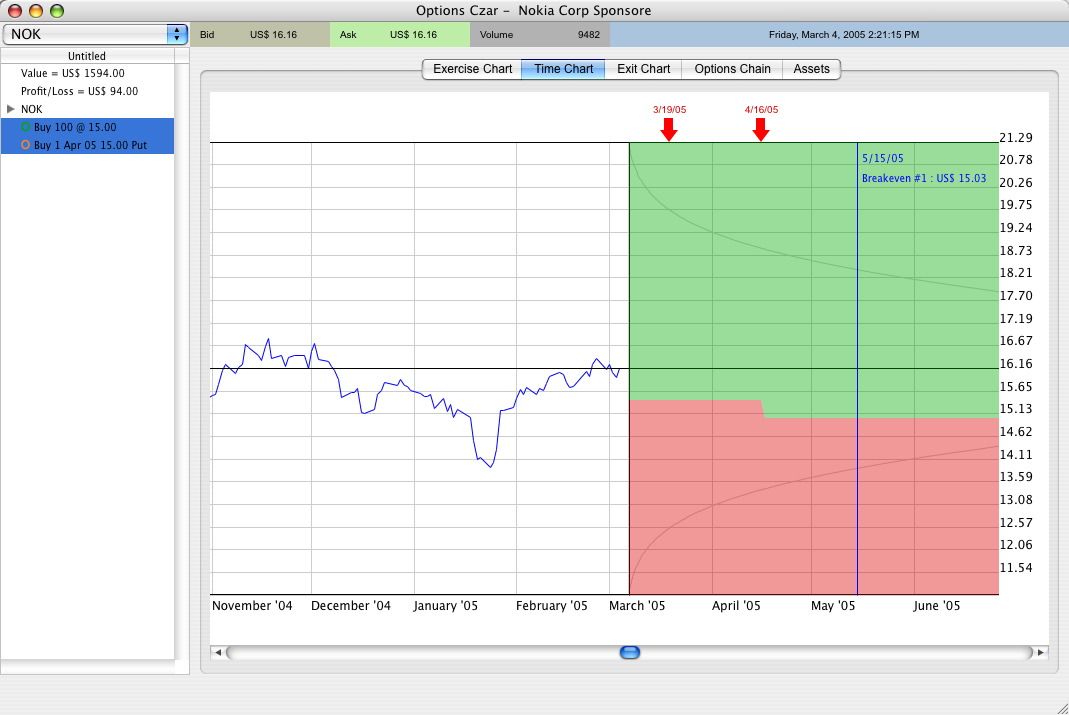
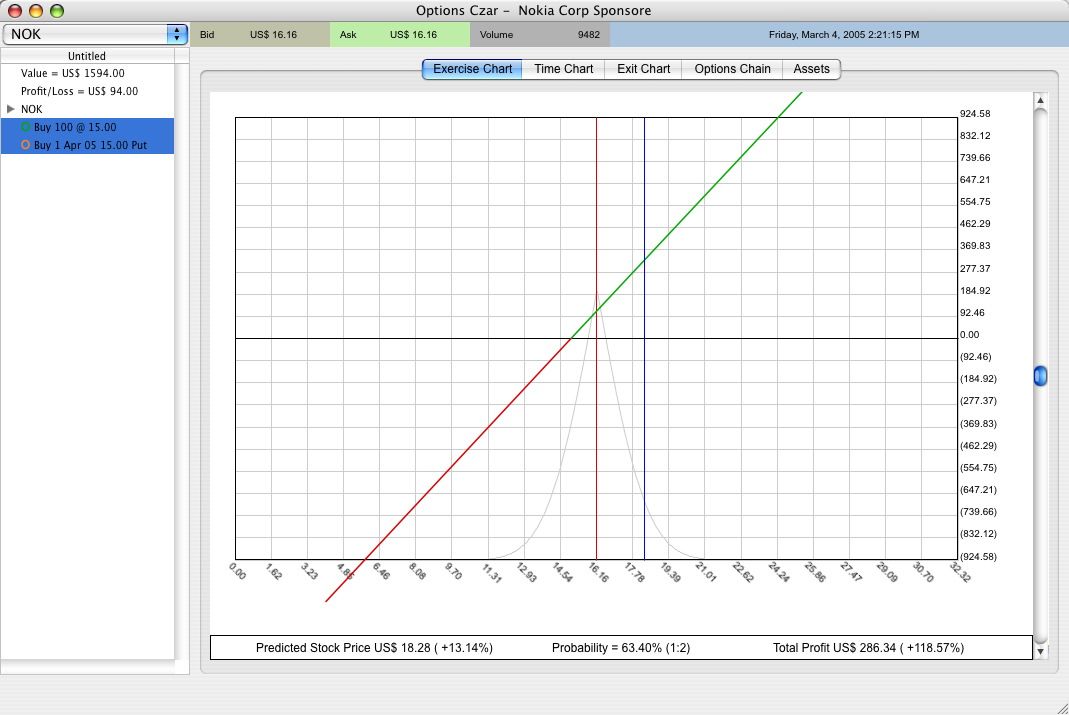
Options Czar will tell you what options you need to buy to achieve a specific Profit/Loss profile. For example, the screen shots below show a Profit/Loss chart and a Time chart for a NOK (Nokia) options strategy (saddle) where the user would benefit from a high volatility. Note that (as in everything), the greatest profits occur from the most "unexpected" occurrences. In this case, the historical volatility is low (note the narrow distribution curve) so the market does not "expect" the stock to move enough to deliver high profits on your options.
In this example, we have introduced three related variables:
- Stock (or underlying asset) Price: The option price is directly proportional to the potential variation of the underlying asset price
- Profits and Losses
- Time
To make the example more complex, we have bought calls and puts with different expiration dates (affecting the Time variable). Therefore, the break-even points up to the March expiration date are not the same as those from the March expiration to the April expiration, because the Put will have expired by then.
For the period up to the March expiration date, if the price drops below the bottom break-even point (in this case US$ 13.61) or rises above the top break-even point (US$ 16.65), the user will obtain a profit. If the stock price remains between the two break-even points, then the user will lose a limited amount. Note that this options strategy was made from the purchase of two options, a call (the right to buy an amount of shares) and a put (the right to sell an amount of shares). It is called a long straddle. A short straddle has an inverted shape and allows the investor to profit from a low volatility (but has a potential for unlimited losses).
For the period from the March expiration date to the April expiration date (a function of the CBOE expiration calendar), if the stock price rises above US$ 16.46 then the user obtains a profit. Although not common, the strategy explained before would make sense if the investor is expecting a sudden movement in the share price (e.g. the quarterly profits will be announced) but after the announcement, the price would be sure to increase.
The time chart (above right) can reveal how the exit strategy would perform from the current time to to expiration. To exit a strategy is to re-purchase in case you have shorted (i.e. sold what you don't have) or sell what you have bought. Note that options lose their value with time so the profits vs. time will represent a curve. In this case, the curves get wider so at a later date, the underlying asset price has to move more in order to make a profit by exiting the strategy.
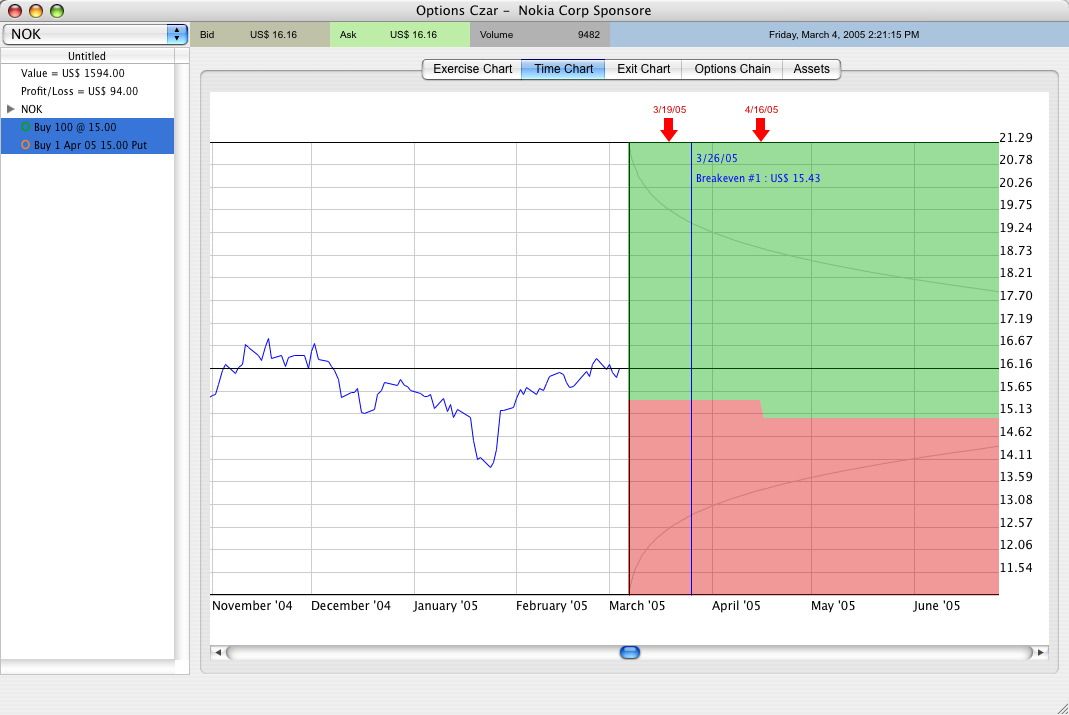
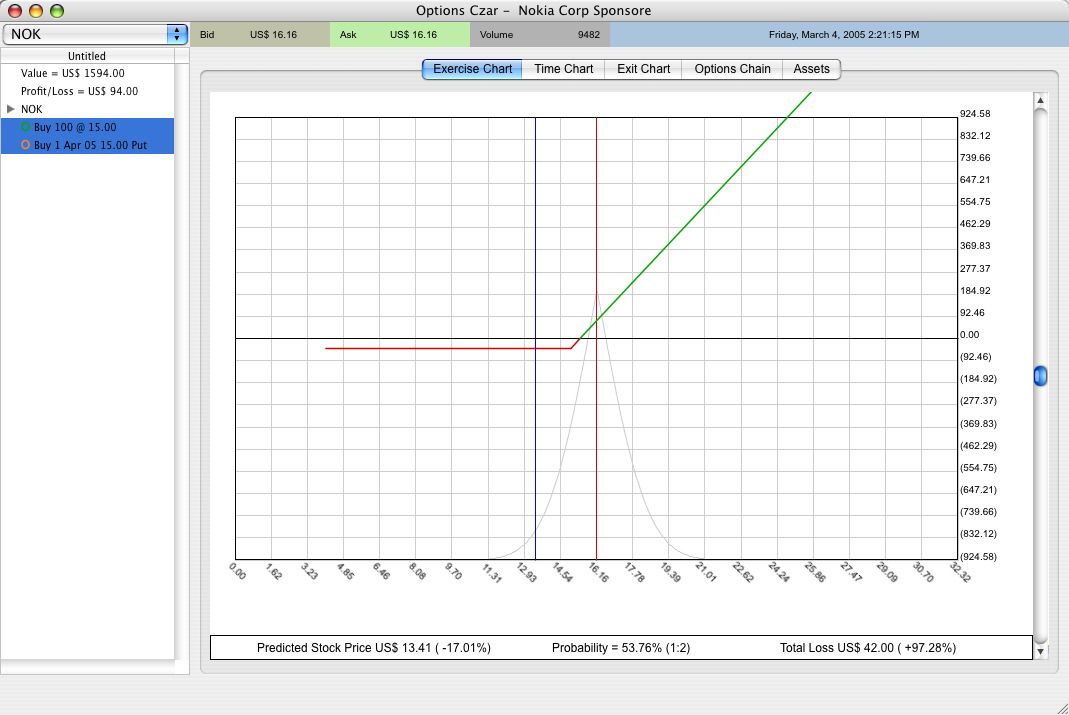
Options can also help investors limit the losses on their stock portfolio by combining options and stock operations. The screen shots below shows an example of another options strategy (a protective put), where the stock owner has bought Puts in order to compensate for the losses in case the stock price drops.
The screen shots above show how during a given period (before April), the investor protects his stock investment from a drop in the price by purchasing a put (a a ratio of 1 put per 100 shares). The first and second screenshots show the Profit-Loss curve during the period in which the Put option is valid (hasn't expired) which is until the April expiration date. After that, there is a change in the break-even point. The profits and losses will revert to the normal behaviour of an investment in stocks.
Note here that stock contracts (as opposed to options) don't expire. So the investor will continue with a pure-stock strategy beyond the options expiration date. Additionally, a Protective Put like in the example above will only "protect" from a drop in stock prices for a limited time. Hence the insurance metaphor. You pay for your house only once but renew the insurance contract periodically. Stretching the metaphor a bit; if you own 10 houses, then you could live without insuring one of them. If you own stock but also have your eggs in other baskets, you don't have to hedge with options always.
To summarize, Options Czar is:
- A stock portfolio management tool,
- an educational options program and
- an options trading instrument.
As a tool, it is only as good as the use that is given to it. So please take the time to read the documentation that is available at the CBOE's web site, including the Characteristics and Risk of Standardized Options.
|